


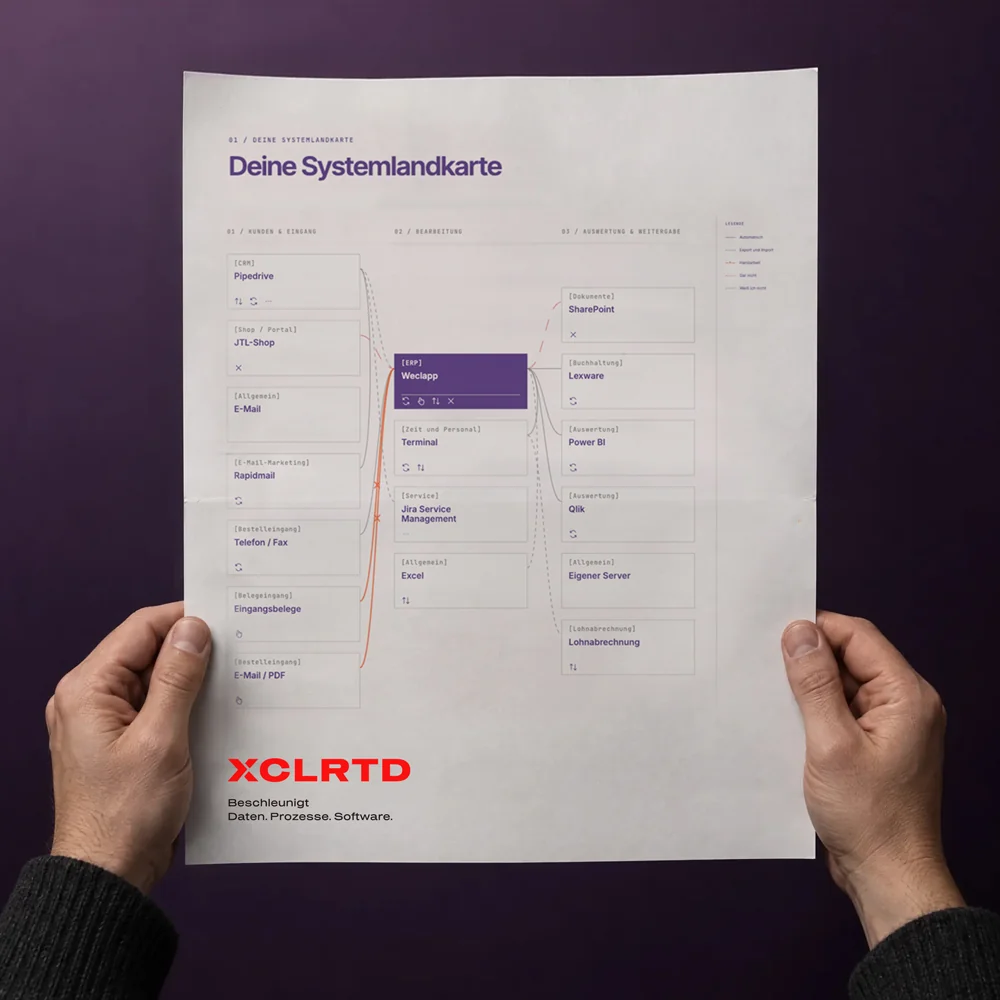
System map
The full picture in minutes
You know your systems. What gets lost between them, usually not. Pick them interactively and see in under ten minutes how big your savings potential could be.
Create your map nowFree · No sign-up · Result straight on screen
SOUND FAMILIAR?
Three sentences. You've heard
every one of them.
- 01
“I've got the figures. I just need to pull them together quickly.”
- 02
“My colleague has always done it that way, for years. Don't ask me how.”
- 03
“The order is in the shop, the CRM and the ERP. It just gets typed in twice...”
That's not bad organisation. That's a system landscape that has grown over time. It's just that nobody has worked out yet what it costs you.
How it works
A few minutes of your time for a fascinating result.
- 01
Industry and order intake
How do orders reach you? Shop, portal, email, phone, fax or EDI?
- 02
Choose systems
From a catalogue of common software for mid-sized companies. We count Excel, email and network drives too – they're systems as well.
- 03
Rate handovers
Explore your data flows interactively. You quickly get an overview and a clear picture of where data isn't flowing cleanly.
- 04
Result
Appears on screen straight away. You can download a detailed report with all key figures free of charge.
Free · No sign-up · Instant result
Step two
Find your savings potential
For the biggest break point in your system we take the calculation further: effort today, effort after automation, with operations offset against it. What's left is freed-up capacity.
See in detail where expensive processes are slowing your business down and how you can fix that.

Derivation
No black box. Every figure with a clear source.
Every figure in the report carries one of four sources. You'll find these letters wherever we use data for the calculation.
- A
- read from your system
- B
- measured during discovery
- C
- benchmark from comparable projects
- D
- provided by you
Here we only use C / D. Results get even clearer when we work together with you and have data from live operations.
Free · No sign-up · Instant result

Our expertise
Who does the maths
As a consultant at XCLRTD, Moritz Grellner combines software engineering with strategy consulting. For more than ten years he led digital projects in the Mittelstand as a consultant at a well-known agency – from positioning and system architecture through to day-to-day operations.
The same pattern shows up every time: projects don't fail because of the technology. They fail because systems that have grown over time don't talk to each other – and people bridge the gaps between them at great cost.
That's exactly where XCLRTD comes in.
Before you start
What you should know
How long does it take?
Under ten minutes. No more than 15 questions, and you can go back at any time.
Do I need to connect anything?
You pick your systems from a catalogue and answer questions about your data flows. The first assessment uses benchmarks and the information you provide.
What happens to my information?
Your information feeds into the system map and the calculation. Every figure in the report shows where it comes from. For the PDF, you enter your company address.
What if I don't know a value?
“I don't know” is a valid answer – and a finding in itself. The source of the figures used stays visible in the report.
What does it cost?
The system map is free. You can start without signing up and see your result on screen straight away.
And after that?
For your biggest break point we take the calculation further: effort today, effort after automation and ongoing operations. Together, using data from live operations, we can work out more precise results.
Ten minutes. Then you'll know
where your capacity goes.
Create your map
Free · No sign-up · Instant result